12. Link Budgets
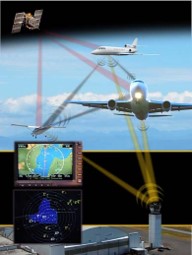
This chapter covers link budgets, a big portion of which is understanding transmit/receive power, path loss, antenna gain, noise, and SNR. We finish by constructing an example link budget for ADS-B, which are signals transmitted by commercial aircraft to share their position and other information.
Introduction
A link budget is an accounting of all of the gains and losses from the transmitter to the receiver in a communication system. Link budgets describe one direction of the wireless link. Most communications systems are bidirectional, so there must be a separate uplink and downlink budget. The “result” of the link budget will tell you roughly how much signal-to-noise ratio (abbreviated as SNR, which this textbook uses, or S/N) you should expect to have at your receiver. Further analysis would be needed to check if that SNR is high enough for your application.
You study link budgets not for the purpose of being able to actually make a link budget for some situation, but to learn and develop a system-layer point of view of wireless communications.
We will first cover the received signal power budget, then the noise power budget, and finally combine the two to find SNR (signal power divided by noise power).
Signal Power Budget
Below shows the most basic diagram of a generic wireless link. In this chapter we will focus on one direction, i.e., from a transmitter (Tx) to receiver (Rx). For a given system, we know the transmit power; it is usually a setting in the transmitter. How do we figure out the received power at the receiver?
We need four system parameters to determine the received power, which are provided below with their common abbreviations. This chapter will delve into each of them.
- Pt - Transmit power
- Gt - Gain of transmit antenna
- Gr - Gain of receive antenna
- Lp - Distance between Tx and Rx (i.e., how much wireless path loss)
Transmit Power
Transmit power is fairly straightforward; it will be a value in watts, dBW, or dBm (recall dBm is shorthand for dBmW). Every transmitter has one or more amplifiers, and the transmit power is mostly a function of those amplifiers. An analogy for transmit power would be the watt rating (power) of a light bulb: the higher the wattage, the more light transmitted by the bulb. Here are examples of approximate transmit power for different technologies:
| Power | ||
| Bluetooth | 10 mW | -20 dBW |
| WiFi | 100mW | -10 dBW |
| LTE base-station | 1W | 0 dBW |
| FM station | 10kW | 40 dBW |
Antenna Gains
Transmit and receive antenna gains are crucial for calculating link budgets. What is the antenna gain, you might ask? It indicates the directivity of the antenna. You might see it referred to as antenna power gain, but don’t let that mislead you, the only way for an antenna to have a higher gain is to direct energy in a more focused region.
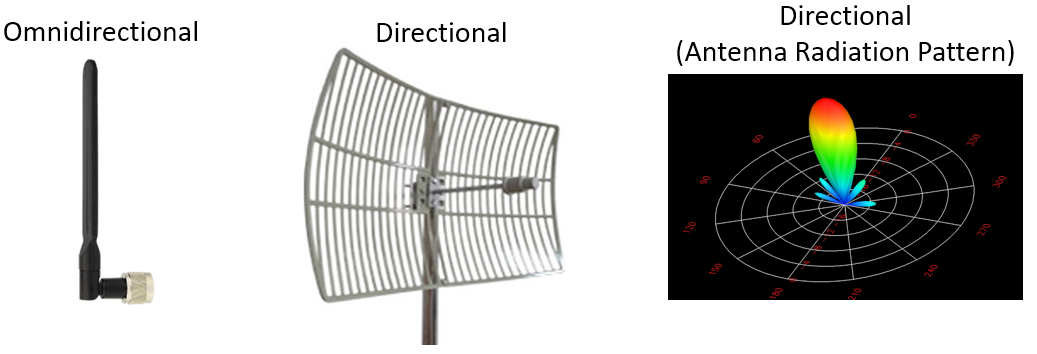
Gains will be depicted in dB (unit-less); feel free to learn or remind yourself why dB is unit-less for our scenario in the Noise and dB chapter. Typically, antennas are either omnidirectional, meaning their power radiates in all directions, or directional, meaning their power radiates in a specific direction. If they are omnidirectional their gain will be 0 dB to 3 dB. A directional antenna will have a higher gain, usually 5 dB or higher, and anywhere up to 60 dB or so.

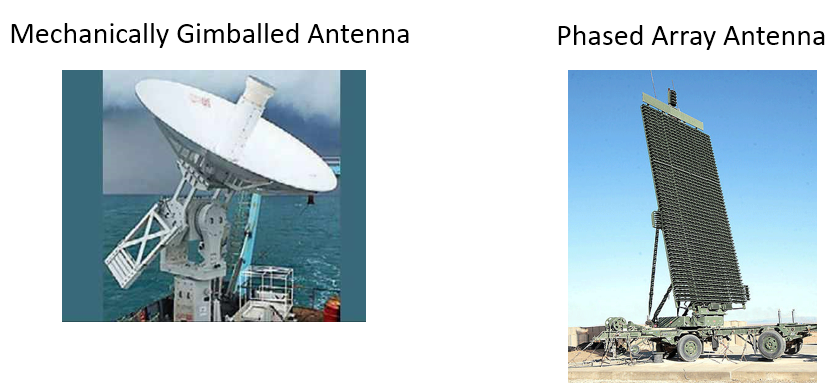
When a directional antenna is used, it must be either installed facing the correct direction or attached to a mechanical gimbal. It could also be a phased array, which can be electronically steered (i.e., by software).

Omnidirectional antennas are used when pointing in the right direction is not possible, like your cellphone and laptop. In 5G, phones can operate in the higher frequency bands like 28 GHz (Verizon) and 39 GHz (AT&T) using an array of antennas and electronic beam steering.
In a link budget, we must assume that any directional antenna, whether transmit or receive, is pointed in the right direction. If it’s not pointed correctly then our link budget won’t be accurate and there could be loss of communication, (e.g., the satellite dish on your roof gets hit by basketball and moves). In general, our link budgets assume ideal circumstances while adding a miscellaneous loss to account for real-world factors.
Path Loss
As a signal moves through the air (or vacuum), it reduces in strength. Imagine holding a small solar panel in front of a light bulb. The further away the solar panel is, the less energy it will absorb from the light bulb. Flux is a term in physics and mathematics, defined as “how much stuff goes through your thing”. For us, it’s the amount of electromagnetic field passing into our receive antenna. We want to know how much power is lost, for a given distance.

Free Space Path Loss (FSPL) tells us the path loss when there are no obstacles for a given distance. In its general form, \(\mathrm{FSPL} = ( 4\pi d / \lambda )^2\). Google Friis transmission formula for more info. (Fun fact: signals encounter 377 ohms impedance moving through free space.) For generating link budgets, we can use this same equation but converted to dB:
In link budgets it will show up in dB, unit-less because it is a loss. \(d\) is in meters and is the distance between the transmitter and receiver. \(f\) is in Hz and is the carrier frequency. There’s only one problem with this simple equation; we won’t always have free space between the transmitter and receiver. Frequencies bounce a lot indoors (most frequencies can go through walls, just not metal or thick masonry). For these situations there are various non-free-space models. A common one for cities and suburban areas (e.g., cellular) is the Okumura–Hata model:
where \(L_{path}\) is the path loss in dB, \(h_B\) is the height of the transmit antenna above ground level in meters, \(f\) is the carrier frequency in MHz, \(d\) is the distance between Tx and Rx in km, and \(C_H\) is called the “antenna high correction factor” and is defined based on the size of city and carrier frequency range:
\(C_H\) for small/medium cities:
\(C_H\) for large cities when \(f\) is below 200 MHz:
\(C_H\) for large cities when \(f\) is above 200 MHz but less than 1.5 GHz:
where \(h_M\) is the height of the receiving antenna above ground level in meters.
Don’t worry if the above Okumura–Hata model seemed confusing; it is mainly shown here to demonstrate how non-free-space path loss models are much more complicated than our simple FSPL equation. The final result of any of these models is a single number we can use for the path loss portion of our link budget. We’ll stick to using FSPL for the rest of this chapter.
Miscellaneous Losses
In our link budget we also want to take into account miscellaneous losses. We will lump these together into one term, usually somewhere between 1 – 3 dB. Examples of miscellaneous losses:
- Cable loss
- Atmospheric Loss
- Antenna pointing imperfections
- Precipitation
The plot below shows atmospheric loss in dB/km over frequency (we will usually be < 40 GHz). If you take some time to understand the y-axis, you’ll see that short range communications below 40 GHz and less than 1 km have 1 dB or less of atmospheric loss, and thus we generally ignore it. When atmospheric loss really comes into play is with satellite communications, where the signal has to travel many km through the atmosphere.
Signal Power Equation
Now it’s time to put all of these gains and losses together to calculate our signal power at the receiver, \(P_r\):
Overall it’s an easy equation. We add up the gains and losses. Some might not even consider it an equation at all. We usually show the gains, losses, and total in a table, similar to accounting, like this:
| Pt = 1.0 W | 0 dBW |
| Gt = 100 | 20.0 dB |
| Gr = 1 | 0 dB |
| Lp | -162.0 dB |
| Lmisc | -1.0 dB |
| Pr | -143.0 dBW |
EIRP
As a quick aside, you may see the metric Effective Isotropic Radiated Power (EIRP), which is defined as \(P_t + G_t - L_{cable}\) and in units of dBW. By summing the transmit power with transmit antenna gain, and subtracting transmit-side cable losses, we get a useful figure that represents the “hypothetical” power that would have to be radiated by an isotropic (perfect omnidirectional) antenna to give the same signal strength in the direction of the antenna’s main beam. This last part is emphasized because any antenna with a high gain (\(G_t\)) only gives that high gain when pointed properly. So assuming you are pointed well, EIRP gives you everything you need to know about the transmit side of the link budget, and thus it is a metric often found in datasheets of directional transmitters such as satellite ground stations (usually in the form of “max EIRP”).
Noise Power Budget
Now that we know the received signal power, let’s change topic to received noise, since we need both to calculate SNR after all. We can find received noise with a similar style power budget.
Now is a good time to talk about where noise enters our communications link. Answer: At the receiver! The signal is not corrupted with noise until we go to receive it. It is extremely important to understand this fact! Many students don’t quite internalize it, and they end up making a foolish error as a result. There is not noise floating around us in the air. The noise comes from the fact that our receiver has an amplifier and other electronics that are not perfect and not at 0 degrees Kelvin (K).
A popular and simple formulation for the noise budget uses the “kTB” approach:
- \(k\) – Boltzmann’s constant = 1.38 x 10⁻²³ J/K = -228.6 dBW/K/Hz. For anyone curious, Boltzmann’s constant is a physical constant relating the average kinetic energy of particles in a gas with the temperature of the gas.
- \(T\) – System noise temperature in K (cryocoolers anyone?), largely based on our amplifier. This is the term that is most difficult to find, and is usually very approximate. You might pay more for an amplifier with a lower noise temperature.
- \(B\) – Signal bandwidth in Hz, assuming you filter out the noise around your signal. So an LTE downlink signal that is 10 MHz wide will have \(B\) set to 10 MHz, or 70 dBHz.
Multiplying out (or adding in dB) kTB gives our noise power, i.e., the bottom term of of our SNR equation.
SNR
Now that we have both numbers, we can take the ratio to find SNR, (see the Noise and dB chapter for more information about SNR):
We typically shoot for an SNR > 10 dB, although it really depends on the application. In practice, SNR can be verified by looking at the FFT of the received signal or by calculating the power with and without the signal present (recall variance = power). The higher the SNR, the more bits per symbol you can manage without too many errors.
Example Link Budget: ADS-B
Automatic Dependent Surveillance-Broadcast (ADS-B) is a technology used by aircraft to broadcast signals that share their position and other status with air traffic control ground stations and other aircraft. ADS-B is automatic in that it requires no pilot or external input; it depends on data from the aircraft’s navigation system and other computers. The messages are not encrypted (yay!). ADS-B equipment is currently mandatory in portions of Australian airspace, while the United States requires some aircraft to be equipped, depending on the size.

The Physical (PHY) Layer of ADS-B has the following characteristics:
- Transmitted on 1,090 MHz
- Signal bandwidth around 2 MHz
- PPM modulation
- Data rate of 1 Mbit/s, with messages between 56 - 112 microseconds
- Messages carry 15 bytes of data each, so multiple messages are usually needed for the entire aircraft information
- Multiple access is achieved by having messages broadcast with a period that ranges randomly between 0.4 and 0.6 seconds. This randomization is designed to prevent aircraft from having all of their transmissions on top of each other (some may still collide but that’s fine)
- ADS-B antennas are vertically polarized
- Transmit power varies, but should be in the ballpark of 100 W (20 dBW)
- Transmit antenna gain is omnidirectional but only pointed downward, so let’s say 3 dB
- ADS-B receivers also have an omnidirectional antenna gain, so let’s say 0 dB
The path loss depends on how far away the aircraft is from our receiver. As an example, it’s about 30 km between the University of Maryland (where the course that this textbook’s content originated from was taught) and the BWI airport. Let’s calculate FSPL for that distance and a frequency of 1,090 MHz:
Another option is to leave \(d\) as a variable in the link budget and figure out how far away we can hear signals based on a required SNR.
Now because we definitely won’t have free space, let’s add another 3 dB of miscellaneous loss. We will make the miscellaneous loss 6 dB total, to take into account our antenna not being well matched and cable/connector losses. Given all of this criteria, our signal link budget looks like:
| Pt | 20 dBW |
| Gt | 3 dB |
| Gr | 0 dB |
| Lp | -122.7 dB |
| Lmisc | -6 dB |
| Pr | -105.7 dBW |
For our noise budget:
- B = 2 MHz = 2e6 = 63 dBHz
- T we have to approximate, let’s say 300 K, which is 24.8 dBK. It will vary based on quality of the receiver
- k is always -228.6 dBW/K/Hz
Therefore our SNR is -105.7 - (-140.8) = 35.1 dB. It’s not surprising it is a huge number, considering we are claiming to only be 30 km from the aircraft under free space. If ADS-B signals couldn’t reach 30 km then ADS-B wouldn’t be a very effective system–no one would hear each other until they were very close. Under this example we can easily decode the signals; pulse-position modulation (PPM) is fairly robust and does not require that high an SNR. What’s difficult is when you try to receive ADS-B while inside a classroom, with an antenna that is very poorly matched, and a strong FM radio station nearby causing interference. Those factors could easily lead to 20-30 dB of losses.
This example was really just a back-of-the-envelope calculation, but it demonstrated the basics of creating a link budget and understanding the important parameters of a communications link.
